BEHAVIOR
OVER TIME GRAPHS
Behavior
over time (BOT) graphs are a kind of systems thinking tool.
Like other basic graphs, they have horizontal and vertical axes,
with a line showing how something is changing over time. You
draw a BOT graph in order to depict patterns of behavior that
you want to explore from a systems thinking perspective. For
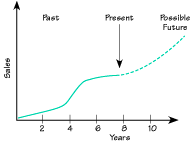
example, you might want to show changes in your company's sales
over the past, say, five years—as well as future sales
patterns that you'd like or expect to see happen.
BOT
graphs often reveal "signature" patterns of behavior
that indicate that a particular systemic process is at work.
For instance, suppose your company makes a cell phone with
snazzy new features on it. If your graph of the sales history
of this product shows sales increasing dramatically and then
leveling off, then perhaps your product is experiencing market
saturation—e.g., everyone who wants one of these phones
has bought one. This is a common eventual constraint on the
sales growth of a hot new product.
You
can also graph more than one thing on a BOT graph, which helps
you see how the two things might be related. To illustrate,
suppose you graphed your cell-phone sales history and the
number of dollars spent on marketing for that product. You
might come up with a graph that looks like this:
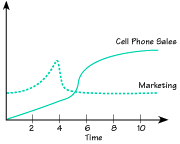
This graph vividly shows how a rise in investment in marketing
a product might be contributing to a jump in sales of that
product.
BOT
graphs also encourage you to think about what time frame to
use in your analysis. For example, if it typically takes several
years to develop a new product, you wouldn't want to graph
"number of new products developed" over the course
of just a few quarters—you'd want to extend that horizontal
axis of your graph to include plenty of product-development
cycles, perhaps six or 10 years' worth to start seeing patterns.
Though
they might seem simple at first, BOT graphs let you form some
theories about why things might be happening as they are in
your organization. And once you form some theories, you have
a much better chance of testing them—and possibly turning
around some of the more troubling patterns!
|