|
CAUSAL
LOOP DIAGRAMS
Causal loop diagrams (CLDs) are a kind
of systems thinking tool. These diagrams consist of arrows
connecting variables (things that change over time) in a way
that shows how one variable affects another. Here are some
examples:
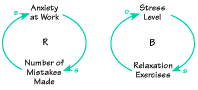
Each
arrow in a causal loop diagram is labeled with an "s"
or an "o." "S" means that when the first
variable changes, the second one changes in the same direction
(for example, as your anxiety at work goes up, the number
of mistakes you make goes up, too). "O" means that
the first variables causes a change in the opposite direction
in the second variable (for example, the more relaxation exercises
you do, the less stressed you feel).
In
CLDs, the arrows come together to form loops, and each loop
is labeled with an "R" or a "B." "R"
means reinforcing; i.e., the causal relationships within the
loop create exponential growth or collapse. (For instance,
the more anxious you are at work, the more mistakes you make,
and as you make more mistakes, you get even more anxious,
and so on, in a vicious, upward spiral). "B" means
balancing; i.e., the causal influences in the loop keep things
in equilibrium. (For example, if you feel more stressed, you
do more relaxation exercises, which brings your stress level
down.)
CLDs
can contain many different "R" and "B"
loops, all connected together with arrows. By drawing these
diagrams with your work team or other colleagues, you can
get a rich array of perspectives on what's happening in your
organization. You can then look for ways to make changes so
as to improve things. For example, by understanding the connection
between anxiety and mistakes, you could look for ways to reduce
anxiety in your organization.
|